SKU:RB-02S112 电子罗盘
来自ALSROBOT WiKi
目录 |
产品概述
电子罗盘,又称数字罗盘,在现代技术条件中电子罗盘作为导航仪器或姿态传感器已被广泛应用。此款传感器是三轴数字罗盘,采用I2C串行总线接口,芯片选用Honeywell HMC5883L,具有高精度,偏移抑制等特点。此传感器具有12位ADC、低噪声、自检测、低电压操作和宽磁场范围等特点,并且内置驱动电路,采用I2C数字接口,体积小,轻便,操作简单。
产品参数
- 产品类型:数字传感器
- 接口类型:KF2510
- 工作电压:5V
- 工作温度:-25℃~+85℃
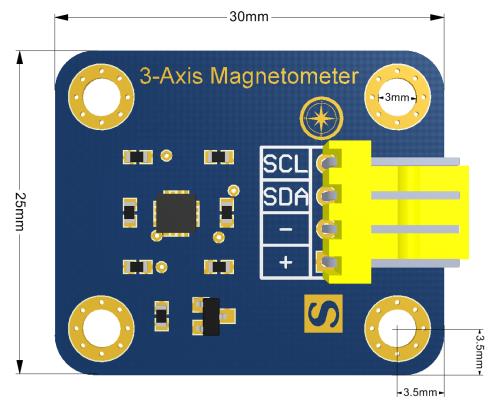
- 产品尺寸(mm):30x25mm
- 固定孔尺寸(mm):M3 * 4个
- 固定孔间距:23 * 18 mm
- 重量(g):3g
- 产品尺寸图:
基本使用方法
1、测试环境
- 硬件环境:Arduino 、电子罗盘
- 软件环境:Arduino IDE 1.7.7
2、引脚定义
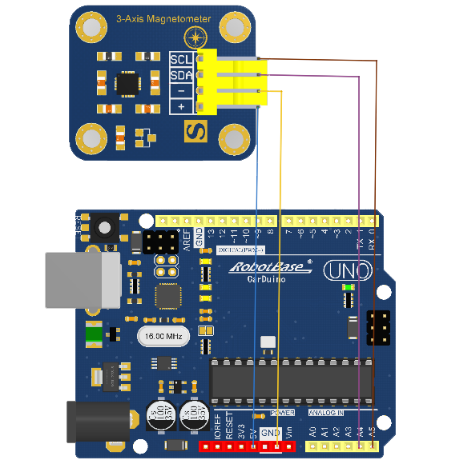
- SDA:I2C总线的数据线引脚
- SCL:2C总线的时钟信号引脚
- -:电源负极
- +:电源正极
3、硬件连接
4、测试程序
#include <Wire.h>
#include <HMC5883L.h>

HMC5883L compass;

void setup()
{
  Serial.begin(9600);

  // Initialize HMC5883L
  Serial.println("Initialize HMC5883L");
  while (!compass.begin())
  {
    Serial.println("Could not find a valid HMC5883L sensor, check wiring!");
    delay(500);
  }

  // Set measurement range
  // +/- 0.88 Ga: HMC5883L_RANGE_0_88GA
  // +/- 1.30 Ga: HMC5883L_RANGE_1_3GA (default)
  // +/- 1.90 Ga: HMC5883L_RANGE_1_9GA
  // +/- 2.50 Ga: HMC5883L_RANGE_2_5GA
  // +/- 4.00 Ga: HMC5883L_RANGE_4GA
  // +/- 4.70 Ga: HMC5883L_RANGE_4_7GA
  // +/- 5.60 Ga: HMC5883L_RANGE_5_6GA
  // +/- 8.10 Ga: HMC5883L_RANGE_8_1GA
  compass.setRange(HMC5883L_RANGE_1_3GA);

  // Set measurement mode
  // Idle mode:              HMC5883L_IDLE
  // Single-Measurement:     HMC5883L_SINGLE
  // Continuous-Measurement: HMC5883L_CONTINOUS (default)
  compass.setMeasurementMode(HMC5883L_CONTINOUS);

  // Set data rate
  //  0.75Hz: HMC5883L_DATARATE_0_75HZ
  //  1.50Hz: HMC5883L_DATARATE_1_5HZ
  //  3.00Hz: HMC5883L_DATARATE_3HZ
  //  7.50Hz: HMC5883L_DATARATE_7_50HZ
  // 15.00Hz: HMC5883L_DATARATE_15HZ (default)
  // 30.00Hz: HMC5883L_DATARATE_30HZ
  // 75.00Hz: HMC5883L_DATARATE_75HZ
  compass.setDataRate(HMC5883L_DATARATE_15HZ);

  // Set number of samples averaged
  // 1 sample:  HMC5883L_SAMPLES_1 (default)
  // 2 samples: HMC5883L_SAMPLES_2
  // 4 samples: HMC5883L_SAMPLES_4
  // 8 samples: HMC5883L_SAMPLES_8
  compass.setSamples(HMC5883L_SAMPLES_1);

  // Check settings
  checkSettings();
}

void checkSettings()
{
  Serial.print("Selected range: ");

  switch (compass.getRange())
  {
    case HMC5883L_RANGE_0_88GA: Serial.println("0.88 Ga"); break;
    case HMC5883L_RANGE_1_3GA:  Serial.println("1.3 Ga"); break;
    case HMC5883L_RANGE_1_9GA:  Serial.println("1.9 Ga"); break;
    case HMC5883L_RANGE_2_5GA:  Serial.println("2.5 Ga"); break;
    case HMC5883L_RANGE_4GA:    Serial.println("4 Ga"); break;
    case HMC5883L_RANGE_4_7GA:  Serial.println("4.7 Ga"); break;
    case HMC5883L_RANGE_5_6GA:  Serial.println("5.6 Ga"); break;
    case HMC5883L_RANGE_8_1GA:  Serial.println("8.1 Ga"); break;
    default: Serial.println("Bad range!");
  }

  Serial.print("Selected Measurement Mode: ");
  switch (compass.getMeasurementMode())
  {
    case HMC5883L_IDLE: Serial.println("Idle mode"); break;
    case HMC5883L_SINGLE:  Serial.println("Single-Measurement"); break;
    case HMC5883L_CONTINOUS:  Serial.println("Continuous-Measurement"); break;
    default: Serial.println("Bad mode!");
  }

  Serial.print("Selected Data Rate: ");
  switch (compass.getDataRate())
  {
    case HMC5883L_DATARATE_0_75_HZ: Serial.println("0.75 Hz"); break;
    case HMC5883L_DATARATE_1_5HZ:  Serial.println("1.5 Hz"); break;
    case HMC5883L_DATARATE_3HZ:  Serial.println("3 Hz"); break;
    case HMC5883L_DATARATE_7_5HZ: Serial.println("7.5 Hz"); break;
    case HMC5883L_DATARATE_15HZ:  Serial.println("15 Hz"); break;
    case HMC5883L_DATARATE_30HZ: Serial.println("30 Hz"); break;
    case HMC5883L_DATARATE_75HZ:  Serial.println("75 Hz"); break;
    default: Serial.println("Bad data rate!");
  }

  Serial.print("Selected number of samples: ");
  switch (compass.getSamples())
  {
    case HMC5883L_SAMPLES_1: Serial.println("1"); break;
    case HMC5883L_SAMPLES_2: Serial.println("2"); break;
    case HMC5883L_SAMPLES_4: Serial.println("4"); break;
    case HMC5883L_SAMPLES_8: Serial.println("8"); break;
    default: Serial.println("Bad number of samples!");
  }

}

void loop()
{
  Vector raw = compass.readRaw();
  Vector norm = compass.readNormalize();

  Serial.print(" Xraw = ");
  Serial.print(raw.XAxis);
  Serial.print(" Yraw = ");
  Serial.print(raw.YAxis);
  Serial.print(" Zraw = ");
  Serial.print(raw.ZAxis);
  Serial.print(" Xnorm = ");
  Serial.print(norm.XAxis);
  Serial.print(" Ynorm = ");
  Serial.print(norm.YAxis);
  Serial.print(" ZNorm = ");
  Serial.print(norm.ZAxis);
  Serial.println();

  delay(100);
}
5、程序效果
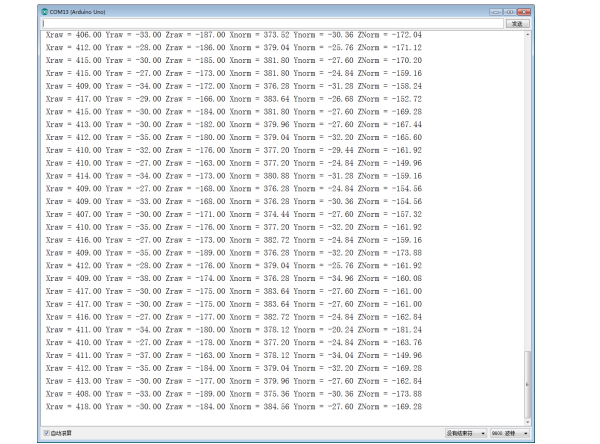
在串口监控窗口中分别打印X、Y、Z轴输出值,如图所示:
Processing指南针
1、测试环境
- 硬件环境:Arduino 、电子罗盘
- 软件环境:Arduino IDE 1.7.7、Processing 3.0.2软件
2、硬件连接
3、例子程序
- Processing 例程代码
/*
    HMC5883L Triple Axis Digital Compass.
    Processing for HMC5883L_processing.ino
    Processing for HMC5883L_processing_MPU6050.ino
    Read more: http://www.jarzebski.pl/arduino/czujniki-i-sensory/3-osiowy-magnetometr-hmc5883l.html
    GIT: https://github.com/jarzebski/Arduino-HMC5883L
    Web: http://www.jarzebski.pl
    (c) 2014 by Korneliusz Jarzebski
*/

import processing.serial.*;

Serial myPort;

// Data samples
int actualSample = 0;
int maxSamples = 400;
int sampleStep = 1;
boolean hasData = false;

// Charts
PGraphics pgChart;
int[] colors = { #ff4444, #33ff99, #5588ff };
String[] magneticSeries = { "XAxis", "YAxis", "ZAxis" };
String[] headingSeries = { "Normal", "Fixed", "Smooth" };

// Data for compare
float[][] magneticValues = new float[3][maxSamples];
float[][] headingValues = new float[3][maxSamples];

// Artificial Horizon
PGraphics pgCompassPlate;
PImage imgCompass;
PImage imgCompassRing;
PImage imgCompassPlateWhite;
PImage imgCompassPlateBlack;
int compassWidth;
int compassHeight;

void setup ()
{
  size(755, 550, P2D);
  background(0);

  // Init
  initCompass();

  // Serial
  myPort = new Serial(this, Serial.list()[0], 9600);
  myPort.bufferUntil(10);
}

void drawChart(String title, String[] series, float[][] chart, int x, int y, int h, boolean symmetric, boolean fixed, int fixedMin, int fixedMax, int hlines)
{
  int actualColor = 0;

  int maxA = 0;
  int maxB = 0;
  int maxAB = 0;

  int min = 0;
  int max = 0;
  int step = 0;
  int divide = 0;

  if (fixed)
  {
    min = fixedMin;
    max = fixedMax;
    step = hlines;
  } else
  {
    if (hlines > 2)
    {
      divide = (hlines - 2);
    } else
    {
      divide = 1;
    }

    if (symmetric)
    {
      maxA = (int)abs(getMin(chart));
      maxB = (int)abs(getMax(chart));
      maxAB = max(maxA, maxB);
      step = (maxAB * 2) / divide;
      min = -maxAB-step;
      max = maxAB+step;
    } else
    {
      min = (int)(getMin(chart));
      max = (int)(getMax(chart));

      if ((max >= 0) && (min <= 0)) step = (abs(min) + abs(max)) / divide;
      if ((max < 0) && (min < 0)) step = abs(min - max) / divide;
      if ((max > 0) && (min > 0)) step = (max - min) / divide;

      if (divide > 1)
      {
        min -= step;
        max += step;
      }
    }
  }

  pgChart = createGraphics((maxSamples*sampleStep)+50, h+60);

  pgChart.beginDraw();

  // Draw chart area and title
  pgChart.background(0);
  pgChart.strokeWeight(1);
  pgChart.noFill();
  pgChart.stroke(50);
  pgChart.rect(0, 0, (maxSamples*sampleStep)+49, h+59);
  pgChart.text(title, ((maxSamples*sampleStep)/2)-(textWidth(title)/2)+40, 20);

  // Draw chart description
  String Description[] = new String[chart.length];
  int DescriptionWidth[] = new int[chart.length];
  int DesctiptionTotalWidth = 0;
  int DescriptionOffset = 0;

  for (int j = 0; j < chart.length; j++)
  {
     Description[j] = "  "+series[j]+" = ";
     DescriptionWidth[j] += textWidth(Description[j]+"+0000.00");
     Description[j] += nf(chart[j][actualSample-1], 0, 2)+"  ";
     DesctiptionTotalWidth += DescriptionWidth[j];
  }

  actualColor = 0;

  for (int j = 0; j < chart.length; j++)
  {
    pgChart.fill(colors[actualColor]);
    pgChart.text(Description[j], ((maxSamples*sampleStep)/2)-(DesctiptionTotalWidth/2)+DescriptionOffset+40, h+50);
    DescriptionOffset += DescriptionWidth[j];
    actualColor++;
    if (actualColor >= colors.length) actualColor = 0;
  }

  // Draw H-Lines
  pgChart.stroke(100);

  for (float t = min; t <= max; t=t+step)
  {
    float line = map(t, min, max, 0, h);
    pgChart.line(40, h-line+30, (maxSamples*sampleStep)+40, h-line+30);
    pgChart.fill(200, 200, 200);
    pgChart.textSize(12);
    pgChart.text(int(t), 5, h-line+34);
  }

  // Draw data series
  pgChart.strokeWeight(2);

  for (int i = 1; i < actualSample; i++)
  {
    actualColor = 0;

    for (int j = 0; j < chart.length; j++)
    {
      pgChart.stroke(colors[actualColor]);

      float d0 = chart[j][i-1];
      float d1 = chart[j][i];

      if (d0 < min) d0 = min;
      if (d0 > max) d0 = max;
      if (d1 < min) d1 = min;
      if (d1 > max) d1 = max;

      float v0 = map(d0, min, max, 0, h);
      float v1 = map(d1,   min, max, 0, h);

      pgChart.line(((i-1)*sampleStep)+40, h-v0+30, (i*sampleStep)+40, h-v1+30);

      actualColor++;

      if (actualColor >= colors.length) actualColor = 0;
    }
  }

  pgChart.endDraw();

  image(pgChart, x, y);
}

void initCompass()
{
  imgCompass = loadImage("compass.png");
  imgCompassRing = loadImage("compassRing.png");
  imgCompassPlateWhite = loadImage("compassPlateWhite.png");
  imgCompassPlateBlack = loadImage("compassPlateBlack.png");
  compassWidth = imgCompass.width;
  compassHeight = imgCompass.height;
}

void drawCompass(int x, int y, float[][] head, PImage plate)
{
  pgCompassPlate = createGraphics(compassWidth, compassWidth);

  float heading = head[2][actualSample-1];
  float north = 180 + heading;

  pgCompassPlate.beginDraw();
  pgCompassPlate.clear();
  pgCompassPlate.translate(100,100);
  pgCompassPlate.rotate(-radians(heading));
  pgCompassPlate.image(plate, -100, -100);
  pgCompassPlate.endDraw();

  image(pgCompassPlate, x+30, y+30);
  image(imgCompass, x, y);
  image(imgCompassRing, x, y);

  textAlign(CENTER);
  text((int)heading+" deg", x+130, y+265);
  textAlign(LEFT);
}

void draw()
{
  if (!hasData) return;

  background(0);

  drawChart("Magnetic field [mG]", magneticSeries, magneticValues, 10, 10, 200, false, false, 0, 0, 10);
  drawChart("Heading [deg]", headingSeries, headingValues, 10, 280, 200, true, true, 0, 360, 30);
  drawCompass(480, 5, headingValues, imgCompassPlateWhite);
  drawCompass(480, 275, headingValues, imgCompassPlateBlack);

}

float getMin(float[][] chart)
{
  float minValue = 0;
  float[] testValues = new float[chart.length];
  float testMin = 0;

  for (int i = 0; i < actualSample; i++)
  {
    for (int j = 0; j < testValues.length; j++)
    {
      testValues[j] = chart[j][i];
    }

    testMin = min(testValues);

    if (i == 0)
    {
      minValue = testMin;
    } else
    {
      if (minValue > testMin) minValue = testMin;
    }
  }

  return ceil(minValue)-1;
}

float getMax(float[][] chart)
{
  float maxValue = 0;
  float[] testValues = new float[chart.length];
  float testMax = 0;

  for (int i = 0; i < actualSample; i++)
  {
    for (int j = 0; j < testValues.length; j++)
    {
      testValues[j] = chart[j][i];
    }

    testMax = max(testValues);

    if (i == 0)
    {
      maxValue = testMax;
    } else
    {
      if (maxValue < testMax) maxValue = testMax;
    }
  }

  return ceil(maxValue);
}

void nextSample(float[][] chart)
{
    for (int j = 0; j < chart.length; j++)
    {
      float last = chart[j][maxSamples-1];

      for (int i = 1; i < maxSamples; i++)
      {
        chart[j][i-1] = chart[j][i];
      }

      chart[j][(maxSamples-1)] = last;
    }
}

void serialEvent (Serial myPort)
{
  String inString = myPort.readStringUntil(10);

  if (inString != null)
  {
    inString = trim(inString);
    String[] list = split(inString, ':');
    String testString = trim(list[0]);

    if (list.length != 6) return;

    // Magnetic field
    magneticValues[0][actualSample] = (float(list[0]));
    magneticValues[1][actualSample] = (float(list[1]));
    magneticValues[2][actualSample] = (float(list[2]));

    // Headings
    headingValues[0][actualSample] = (float(list[3]));
    headingValues[1][actualSample] = (float(list[4]));
    headingValues[2][actualSample] = (float(list[5]));

    if (actualSample > 1)
    {
      hasData = true;
    }

    if (actualSample == (maxSamples-1))
    {
      nextSample(magneticValues);
      nextSample(headingValues);
   } else
    {
      actualSample++;
    }
  }
}
- Arduino 例程代码
/*
  HMC5883L Triple Axis Digital Compass. Output for HMC5883L_processing.pde
  Read more: http://www.jarzebski.pl/arduino/czujniki-i-sensory/3-osiowy-magnetometr-hmc5883l.html
  GIT: https://github.com/jarzebski/Arduino-HMC5883L
  Web: http://www.jarzebski.pl
  (c) 2014 by Korneliusz Jarzebski
*/

#include <Wire.h>
#include <HMC5883L.h>

HMC5883L compass;

int previousDegree;

void setup()
{
  Serial.begin(9600);

  // Initialize HMC5883L
  while (!compass.begin())
  {
    delay(500);
  }

  // Set measurement range
  compass.setRange(HMC5883L_RANGE_1_3GA);

  // Set measurement mode
  compass.setMeasurementMode(HMC5883L_CONTINOUS);

  // Set data rate
  compass.setDataRate(HMC5883L_DATARATE_30HZ);

  // Set number of samples averaged
  compass.setSamples(HMC5883L_SAMPLES_8);

  // Set calibration offset. See HMC5883L_calibration.ino
  compass.setOffset(0, 0);
}

void loop()
{
  long x = micros();
  Vector norm = compass.readNormalize();

  // Calculate heading
  float heading = atan2(norm.YAxis, norm.XAxis);

  // Set declination angle on your location and fix heading
  // You can find your declination on: http://magnetic-declination.com/
  // (+) Positive or (-) for negative
  // For Bytom / Poland declination angle is 4'26E (positive)
  // Formula: (deg + (min / 60.0)) / (180 / M_PI);
  float declinationAngle = (4.0 + (26.0 / 60.0)) / (180 / M_PI);
  heading += declinationAngle;

  // Correct for heading < 0deg and heading > 360deg
  if (heading < 0)
  {
    heading += 2 * PI;
  }

  if (heading > 2 * PI)
  {
    heading -= 2 * PI;
  }

  // Convert to degrees
  float headingDegrees = heading * 180/M_PI;

  // Fix HMC5883L issue with angles
  float fixedHeadingDegrees;

  if (headingDegrees >= 1 && headingDegrees < 240)
  {
    fixedHeadingDegrees = map(headingDegrees, 0, 239, 0, 179);
  } else
  if (headingDegrees >= 240)
  {
    fixedHeadingDegrees = map(headingDegrees, 240, 360, 180, 360);
  }

  // Smooth angles rotation for +/- 3deg
  int smoothHeadingDegrees = round(fixedHeadingDegrees);

  if (smoothHeadingDegrees < (previousDegree + 3) && smoothHeadingDegrees > (previousDegree - 3))
  {
    smoothHeadingDegrees = previousDegree;
  }

  previousDegree = smoothHeadingDegrees;

  // Output
  Serial.print(norm.XAxis);
  Serial.print(":");
  Serial.print(norm.YAxis);
  Serial.print(":");
  Serial.print(norm.ZAxis);
  Serial.print(":");
  Serial.print(headingDegrees);
  Serial.print(":");
  Serial.print(fixedHeadingDegrees);
  Serial.print(":");
  Serial.print(smoothHeadingDegrees);
  Serial.println();

  // One loop: ~5ms @ 115200 serial.
  // We need delay ~28ms for allow data rate 30Hz (~33ms)
  delay(30);
}
4、程序效果
将 Arduino 例程代码上传到 Arduino 控制器中,然后在 Processing 编译器中运行例程代码,会看到如下效果
产品相关推荐
例子程序下载
- 库文件及例子程序下载链接:http://pan.baidu.com/s/1pLQ9dsZ 密码:gedq


